Summary:
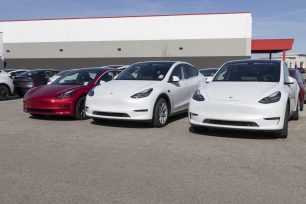
- Electric vehicles are the worst segment at holding their value, losing 49.1 percent in five years
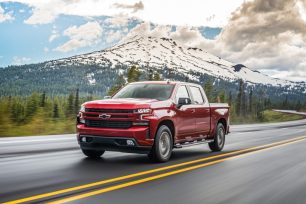
- Trucks and hybrids retain the most value, losing only 35 and 37 percent, respectively
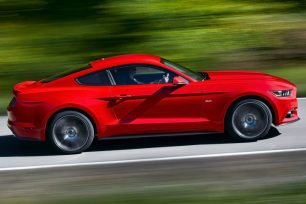
- Several sports cars, small SUVs and economy cars also hold their value extremely well, with the Porsche 911, Jeep Wrangler and Honda Civic among the best models
- Luxury SUVs and sedans, including the Maserati Quattroporte, BMW 7 series and Maserati Ghibli, are some of the worst vehicles at holding their value
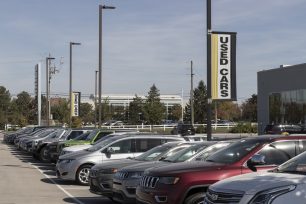
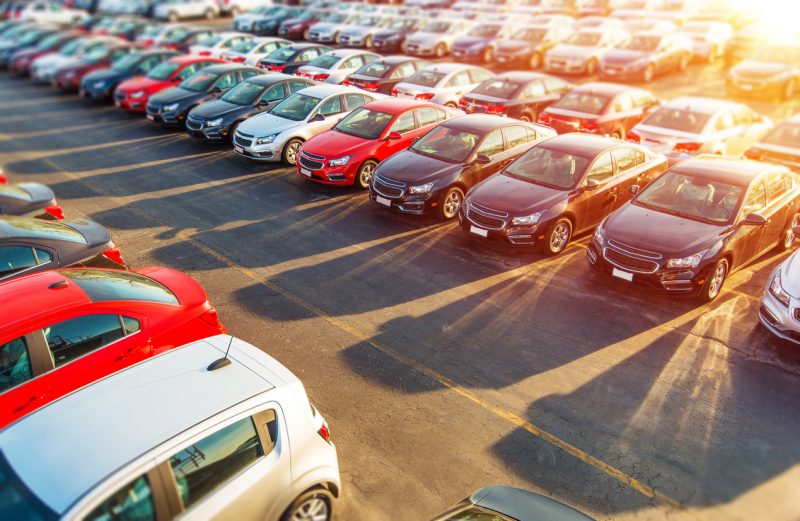
All cars are holding their value better in 2023 compared to 2019 as a result of reduced new car production during the pandemic and constrained used car supply today. Prior to the pandemic, the average car would lose about 50 percent of its value in five years. Today the average 5-year depreciation is 38.8 percent, with electric vehicles the worst group – losing approximately half their value.
iSeeCars analyzed over 1.1 million vehicles sold from November 2022 to October 2023 to determine 5-year depreciation rates. In comparing this data historically, it found that depreciation was lower across major segments than in 2019.
“The good news for car owners is that all used cars hold their value better than they did five years ago,” said Karl Brauer, iSeeCars executive analyst. “But not all used cars retain value equally, with trucks and hybrids among the best segments and electric vehicles the worst. Hybrids have a nearly 12 percentage point advantage over EVs in value retention, which translates to thousands of dollars in higher market value after five years.”
EVs have the worst depreciation across major vehicle types
While the average 5-year depreciation for all vehicles is 38.8 percent, electric vehicles are more than 10 percentage points worse at 49.1 percent. SUVs also lose more value than the average vehicle at 41.2 percent.| 5-Year Depreciation for Notable Segments – iSeeCars Study | |||
| Segment | 2023 | 2019 | % Improvement Since 2019 (Percentage Points) |
| Overall | 38.8% | 49.6% | 10.8% |
| Hybrids | 37.4% | 56.7% | 19.3% |
| EVs | 49.1% | 67.1% | 18.0% |
| SUVs | 41.2% | 51.6% | 10.4% |
| Trucks | 34.8% | 42.7% | 7.9% |
Vehicles that depreciated the least over five years
These 25 cars hold their value far better than average. The top-ranked Porsche 911 coupe only loses 9.3 percent of its value after five years, indicating incredibly strong demand for this sports car in the used market. Three other Porsches, along with six Toyotas, four Subarus, and three Chervolets, reflect ongoing consumer demand for sports cars, small SUVs, and fuel-efficient economy cars. The rise in used car pricing over the past few years drove many buyers toward these smaller, lower-priced models.| Top 25 Vehicles With the Lowest 5-Year Depreciation – iSeeCars Study | |||
| Rank | Model | Average 5-Year Depreciation | Average $ Difference from MSRP |
| 1 | Porsche 911 (coupe) | 9.3% | $18,094 |
| 2 | Porsche 718 Cayman | 17.6% | $13,372 |
| 3 | Toyota Tacoma | 20.4% | $8,359 |
| 4 | Jeep Wrangler/Wrangler Unlimited | 20.8% | $8,951 |
| 5 | Honda Civic (sedan/hatchback) | 21.5% | $5,817 |
| 6 | Subaru BRZ | 23.4% | $8,114 |
| 7 | Chevrolet Camaro | 24.2% | $10,161 |
| 8 | Toyota C-HR | 24.4% | $6,692 |
| 9 | Subaru Crosstrek | 24.5% | $7,214 |
| 10 | Toyota Corolla | 24.5% | $5,800 |
| 11 | Ford Mustang | 24.5% | $10,035 |
| 12 | Porsche 718 Boxster | 25.1% | $20,216 |
| 13 | Toyota Tundra | 25.3% | $12,588 |
| 14 | Kia Rio 5-Door | 25.8% | $5,006 |
| 15 | Porsche 911 (convertible) | 26.0% | $42,227 |
| 16 | Honda HR-V | 26.2% | $7,318 |
| 17 | Subaru Impreza (wagon) | 26.2% | $6,927 |
| 18 | Kia Rio | 26.3% | $4,959 |
| 19 | Chevrolet Spark | 26.6% | $4,784 |
| 20 | Toyota RAV4 | 27.2% | $8,858 |
| 21 | Hyundai Accent | 27.4% | $5,353 |
| 22 | Toyota 4Runner | 27.4% | $13,147 |
| 23 | Chevrolet Corvette | 27.5% | $22,712 |
| 24 | Nissan Kicks | 27.5% | $6,560 |
| 25 | Subaru Impreza (sedan) | 27.8% | $7,158 |
| Overall Average | 38.8% | $17,221 | |
Vehicles that depreciated the most over five years
Luxury cars always depreciate faster than mainstream models, with the latest data confirming luxury cars lose an average of 48.1 percent in value after five years. This compares to the industry average of 38.8 percent and 36.8 percent for non-luxury cars. The worst offenders are luxury sedans and luxury SUVs.| Top 25 Vehicles With the Highest 5-Year Depreciation – iSeeCars Study | |||
| Rank | Model | Average 5-Year Depreciation | Average $ Difference from MSRP |
| 1 | Maserati Quattroporte | 64.5% | $90,588 |
| 2 | BMW 7 Series | 61.8% | $72,444 |
| 3 | Maserati Ghibli | 61.3% | $58,623 |
| 4 | BMW 5 Series (hybrid) | 58.8% | $37,975 |
| 5 | Cadillac Escalade ESV | 58.5% | $63,885 |
| 6 | BMW X5 (hybrid) | 58.2% | $44,828 |
| 7 | INFINITI QX80 | 58.1% | $47,399 |
| 8 | Maserati Levante | 57.8% | $55,858 |
| 9 | Jaguar XF | 57.6% | $39,720 |
| 10 | Audi A7 | 57.2% | $48,917 |
| 11 | Audi Q7 | 56.8% | $41,731 |
| 12 | Cadillac Escalade | 56.5% | $59,093 |
| 13 | Audi A6 | 56.3% | $38,252 |
| 14 | Volvo S90 | 55.8% | $35,365 |
| 15 | Nissan Armada | 55.7% | $36,875 |
| 16 | Mercedes-Benz S-Class | 55.7% | $70,563 |
| 17 | Lincoln Navigator L | 55.5% | $57,224 |
| 18 | Mercedes-Benz GLS | 55.5% | $54,523 |
| 19 | Tesla Model S | 55.5% | $60,145 |
| 20 | BMW 5 Series | 55.3% | $39,856 |
| 21 | BMW X5 | 54.7% | $39,992 |
| 22 | Lincoln Navigator | 54.7% | $53,582 |
| 23 | BMW X5 M | 54.0% | $66,277 |
| 24 | Land Rover Range Rover | 53.9% | $68,874 |
| 25 | Cadillac XT5 | 53.9% | $31,737 |
| Overall Average | 38.8% | $17,221 | |
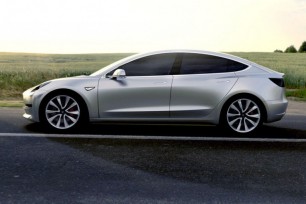
Electric vehicle depreciation – among the worst
Electric vehicles are still relatively new to the market, which limits the ability to track their 5-year depreciation. But all of the EVs below have been in production for at least five years and have lost more value than the 38.8 percent average across all used cars.| Ranking of EVs by 5-Year Depreciation – iSeeCars Study | ||
| Rank | Model | Average 5-Year Depreciation |
| 1 | Tesla Model 3 | 42.9% |
| EV Average | 49.1% | |
| 2 | Tesla Model X | 49.9% |
| 3 | Nissan LEAF | 50.8% |
| 4 | Chevrolet Bolt EV | 51.1% |
| 5 | Tesla Model S | 55.5% |
Hybrid vehicle depreciation – among the best
Hybrid residual values have improved by nearly 20 percentage points in the past 4 years, moving down from 56.7 percent in 2019 to 37.4 percent today. A combination of higher fuel prices and increased familiarity with the technology has expanded the market and raised demand for hybrid vehicles.| Ranking of Hybrids by 5-Year Depreciation – iSeeCars Study | ||
| Rank | Model | Average 5-Year Depreciation |
| 1 | Toyota Prius | 27.9% |
| 2 | Toyota Prius Prime | 28.1% |
| 3 | Toyota RAV4 Hybrid | 29.1% |
| 4 | Toyota Camry Hybrid | 35.3% |
| 5 | Honda Accord Hybrid | 36.4% |
| 6 | Toyota Highlander Hybrid | 36.5% |
| 7 | Hyundai Ioniq Hybrid | 37.4% |
| Hybrid Average | 37.4% | |
| 8 | Kia Niro | 37.6% |
| 9 | Toyota Avalon Hybrid | 43.0% |
| 10 | Hyundai Sonata Hybrid | 43.5% |
| 11 | Lexus ES 300h | 45.2% |
| 12 | Chrysler Pacifica Hybrid | 46.1% |
| 13 | Mitsubishi Outlander PHEV | 46.2% |
| 14 | Porsche Panamera | 47.5% |
| 15 | BMW 3 Series | 52.3% |
| 16 | BMW X5 | 58.2% |
| 17 | BMW 5 Series | 58.8% |
Truck depreciation – Americans still love trucks
As a group, trucks hold their value better than any other vehicle type. The average truck loses just 34.8 percent of its value after five years, reflecting both long-term durability and consistent market demand for these models.| Ranking of Trucks by 5-Year Depreciation – iSeeCars Study | ||
| Rank | Model | Average 5-Year Depreciation |
| 1 | Toyota Tacoma | 20.4% |
| 2 | Toyota Tundra | 25.3% |
| 3 | Chevrolet Colorado | 30.2% |
| 4 | GMC Canyon | 30.2% |
| 5 | Nissan Frontier | 30.9% |
| Truck Average | 34.8% | |
| 6 | Honda Ridgeline | 35.9% |
| 7 | Ford F-150 | 36.0% |
| 8 | GMC Sierra 1500 | 36.9% |
| 9 | Chevrolet Silverado 1500 | 38.3% |
| 10 | Ram 1500 | 40.6% |
| 11 | Nissan Titan XD | 43.1% |
| 12 | Nissan Titan | 43.2% |
The best and worst SUVs for depreciation
SUVs remain the most dominant vehicle type in today’s car market. Their combination of an elevated ride height, comfortable passenger space, and practical cargo capacity make them popular choices, but not all SUVs depreciate equally. Smaller models have the advantage, with an average 5-year depreciation of 38 percent, while midsize models lose 42.9 percent and large SUVs lose 51.9 percent of their value.“As SUVs get larger they get more expensive to buy and fuel,” said Brauer. “Large SUVs may be necessary for buyers requiring additional passenger and cargo capacity, but when SUVs pass from new to used status the market clearly favors smaller, more fuel efficient models.”
These are the best and worst SUVs for residual value in each size category below. As with nearly every vehicle segment, luxury SUVs consistently lose more value than mainstream models.
Small SUVs that hold their value the best
| Top 5 Small SUVs With the Lowest 5-Year Depreciation – iSeeCars Study | ||
| Rank | Model | Average 5-Year Depreciation |
| 1 | Toyota C-HR | 24.4% |
| 2 | Subaru Crosstrek | 24.5% |
| 3 | Honda HR-V | 26.2% |
| 4 | Toyota RAV4 | 27.2% |
| 5 | Nissan Kicks | 27.5% |
| Small SUV Average | 38.0% | |
| Top 5 Small SUVs With the Highest 5-Year Depreciation – iSeeCars Study | ||
| Rank | Model | Average 5-Year Depreciation |
| 1 | Cadillac XT5 | 53.9% |
| 2 | Alfa Romeo Stelvio | 52.3% |
| 3 | Jaguar F-PACE | 51.8% |
| 4 | Audi Q5 | 51.6% |
| 5 | Audi SQ5 | 50.2% |
| Small SUV Average | 38.0% | |
| Top 5 Midsize SUVs With the Lowest 5-Year Depreciation – iSeeCars Study | ||
| Rank | Model | Average 5-Year Depreciation |
| 1 | Jeep Wrangler/Wrangler Unlimited | 20.8% |
| 2 | Toyota 4Runner | 27.4% |
| 3 | Toyota Highlander Hybrid | 36.5% |
| 4 | Toyota Highlander | 37.6% |
| 5 | Lexus RX 350 | 40.9% |
| Midsize SUV Average | 42.9% | |
| Top 5 Midsize SUVs With the Highest 5-Year Depreciation – iSeeCars Study | ||
| Rank | Body | Size |
| 1 | BMW X5 (hybrid) | 58.2% |
| 2 | Maserati Levante | 57.8% |
| 3 | Audi Q7 | 56.8% |
| 4 | BMW X5 | 54.7% |
| 5 | BMW X5 M | 54.0% |
| Midsize SUV Average | 42.9% | |
| Top 5 Full-Size SUVs With the Lowest 5-Year Depreciation – iSeeCars Study | ||
| Rank | Model | Average 5-Year Depreciation |
| 1 | Toyota Sequoia | 38.7% |
| 2 | Mercedes-Benz G-Class | 46.3% |
| 3 | Chevrolet Tahoe | 47.0% |
| 4 | GMC Yukon | 48.2% |
| 5 | Chevrolet Suburban | 50.9% |
| Full-Size SUV Average | 51.9% | |
| Top 5 Full-Size SUVs With the Highest 5-Year Depreciation – iSeeCars Study | ||
| Rank | Model | Average 5-Year Depreciation |
| 1 | Cadillac Escalade ESV | 58.5% |
| 2 | INFINITI QX80 | 58.1% |
| 3 | Cadillac Escalade | 56.5% |
| 4 | Nissan Armada | 55.7% |
| 5 | Lincoln Navigator L | 55.5% |
| Full-Size SUV Average | 51.9% | |
The pandemic’s effect lingers on
“Higher new and used car prices are here to stay,” said Brauer. “Until the restricted new car production of model years 2020 through 2022 moves completely through the used car market there will be a lack of vehicles to meet demand. That means better residual value for car owners, but also higher prices for buyers for the foreseeable future.”
Methodology
iSeeCars analyzed over 1.1 million used cars from model year 2018 sold from November 2022 to October 2023. Heavy-duty trucks and vans, models no longer in production as of the 2022 model year, and low-volume models were removed from further analysis. MSRPs from 2018 were inflation-adjusted to 2023 dollars based on data from the US Bureau of Labor Statistics. The difference in average asking price for each vehicle between its MSRP and its used car pricing was mathematically modeled to obtain the vehicle’s depreciation.
About iSeeCars.com