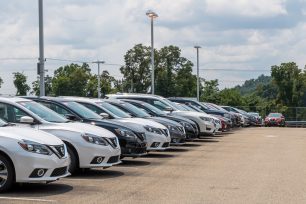
Looking at our extensive database of used car data, iSeeCars noticed that there are some areas in the United States that tend towards safer vehicles than do others. Counting vehicles sold between September of 2015 and August of 2016 with model years of 2011 or newer and noting which received National Highway Traffic Safety Administration (NHTSA) crash test ratings of 5 stars, we noticed a trend.
Top 10 States with the Safest Cars (NHTSA 5-Star Safety Rating)
| Rank | State | % Cars with 5-Star Rating |
| 1 | CA | 57.7% |
| 2 | NJ | 55.7% |
| 3 | FL | 55.1% |
| 4 | RI | 54.8% |
| 5 | MD | 54.2% |
| 6 | IL | 54.0% |
| 7 | CT | 53.9% |
| 7 | UT | 53.9% |
| 8 | MA | 53.7% |
| 8 | GA | 53.7% |
| 9 | VA | 52.8% |
| 10 | OH | 52.7% |
So the question arose: why are car buyers in some states buying safer vehicles than those in other states? There are likely several reasons for this rather than one magic bullet. The two most obvious are population densities and the vehicle types which are most popular in each state.
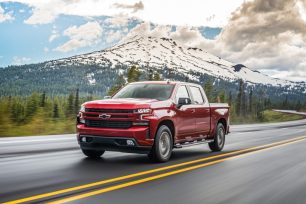
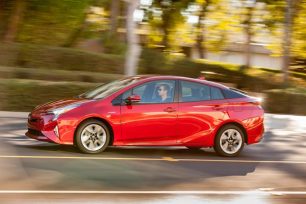
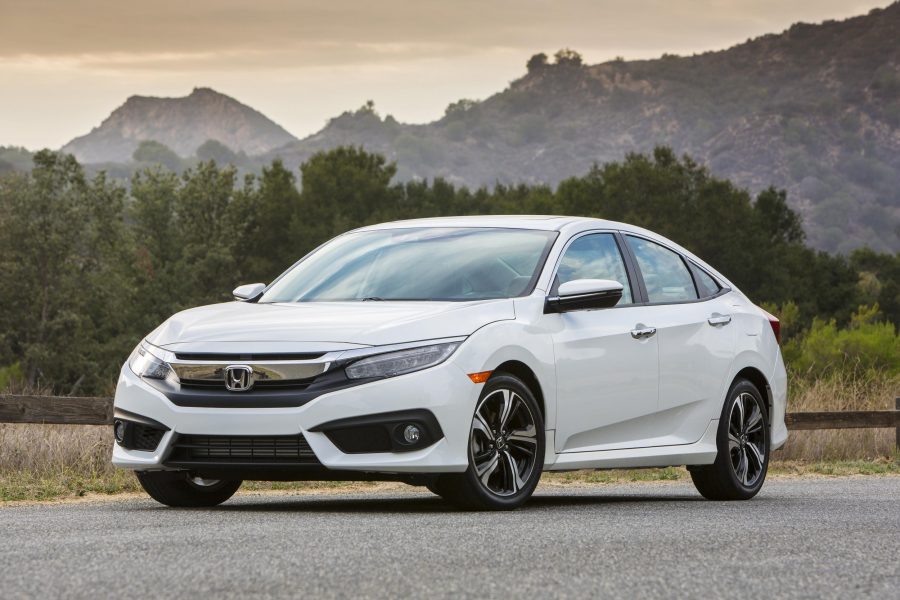
In California, for example, the state wherein the safest cars are found, we note that the top selling vehicles are all compact and midsize sedans (Toyota Camry, Honda Civic and Accord, Nissan Altima). That is a vehicle category where North American Dealers Association (NADA) surveys show that safety is a top priority for buyers and manufacturers. Fuel efficiency is also a priority in that segment, where maximizing efficiency for versatility are important to buyers.
Top 10 States with the Most Cars Rated 2-3 Stars NHTSA Safety Rating
| Rank | State | % 2-3 Star Listings |
| 1 | WY | 3.8% |
| 2 | ID | 3.5% |
| 3 | MT | 3.3% |
| 4 | SD | 3.3% |
| 5 | VT | 3.2% |
| 6 | NH | 3.1% |
| 7 | ME | 3.0% |
| 8 | CO | 2.8% |
| 9 | OK | 2.8% |
| 10 | OR | 2.8% |
Digging deeper, it’s also true that many of the states in the full list of Top 10 States With the Safest Cars are similar, with concentrations of the bulk of the state’s population being in large metropolitan areas (using Census data). Utah, for example, has the majority of its population centered in the Salt Lake and Utah valleys, comprising over a million residents in each location spreading across a large urban and suburban area and the two areas are in close proximity. Some states in that top ten list do not match this criteria so well, however, but seem to be the exception rather than the rule. Georgia and Ohio, for example, are not quite as metro-dense in population as is Utah.
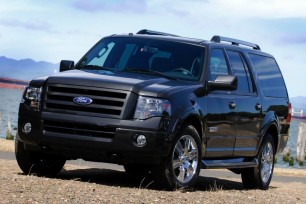
Yet nearly all of the states with the least number of safe cars are rural, though some such as Vermont and New Hampshire do include some very densely populated urban areas.
Further analyzing the data, we were unable to find a correlation with state-specific safety regulations, vehicle registration requirements, or with vehicle equipment safety or emissions testing laws.
At the very least, the information found and the list of states with the most and least safe vehicles is interesting. The answer to the question of why people in some states tend to buy safer vehicles is likely a combination of factors to include need, cultural expectation, and vehicle preferences.
Methodology
iSeeCars.com analyzed over 8 million used cars sold between September 2015 and August 2016 which we’re using as a proxy for cars on the road. Only cars from model year 2011 onward with an overall safety rating from the National Highway Traffic Safety Administration (NHTSA) were included. For the list of Top 10 States with the Safest Cars, the number of cars rated 5-stars by NHTSA in each state were expressed as a percentage of the total number of cars sold in each state. For the list of Top 10 States with the Most Cars Rated 2-3 Stars, the number of cars rated 2- or 3-stars by NHTSA in each state were expressed as a percentage of the total in each state. States were then ranked by these percentages to arrive at the final lists.