People in large cities tend to have higher costs of living and buy smaller cars. Right?
Well, half right. People in large cities do prefer cars with smaller body styles compared to the buying habits of people who don’t live in cities. Yet one of the lowest costs of living in the country is in Houston, Texas, which is also one of the nation’s largest cities.
To look at car preferences in cities versus less crowded areas, iSeeCars analyzed 1.1 million online car inquiries over a 3-year span and compared those coming from the 10 largest US cities to those from everywhere else.
Vehicle Preferences – 10 Largest US Cities vs. Rest of the US
| City | Rank | Sedans | Coupes | Convertibles | Hatchbacks | Luxury Share |
| Top 10 Cities (combined) | -- | 10.5% | -3.2% | -13.1% | -0.4% | 17.2% |
| New York | 1 | -3.7% | -7.4% | -11.0% | -36.1% | 79.7% |
| Los Angeles | 2 | 4.5% | 14.9% | 49.6% | 78.3% | 62.6% |
| Chicago | 3 | 18.7% | -2.3% | -50.7% | -22.7% | -8.2% |
| Houston | 4 | 13.0% | -10.2% | -21.6% | -28.5% | 14.5% |
| Philadelphia | 5 | 15.3% | -33.5% | -55.7% | -33.0% | 6.0% |
| Phoenix | 6 | 3.4% | 14.0% | 41.2% | 40.3% | -2.2% |
| San Antonio | 7 | 2.1% | 18.9% | 3.4% | 24.1% | -6.5% |
| San Diego | 8 | -8.2% | 14.3% | 38.6% | 71.6% | 55.8% |
| Dallas | 9 | 14.4% | 0.5% | 8.5% | 2.0% | 17.3% |
| San Jose | 10 | -5.4% | 1.6% | 0.6% | 84.5% | 48.6% |
| City | Rank | Wagons | SUVs | Pickups | Minivans | |
| Top 10 Cities (combined) | -- | -3.8% | -0.5% | -35.4% | 1.9% | |
| New York | 1 | 38.9% | 36.9% | -77.8% | 46.5% | |
| Los Angeles | 2 | 22.9% | -16.9% | -51.4% | -10.5% | |
| Chicago | 3 | -23.6% | 4.5% | -72.3% | 48.2% | |
| Houston | 4 | -18.9% | 3.8% | -11.3% | -36.9% | |
| Philadelphia | 5 | 27.4% | 6.6% | -47.4% | 42.2% | |
| Phoenix | 6 | -7.3% | -11.5% | -8.1% | -41.1% | |
| San Antonio | 7 | -16.3% | -13.4% | 18.3% | -34.3% | |
| San Diego | 8 | 32.3% | -8.3% | -21.8% | 10.6% | |
| Dallas | 9 | -18.5% | -10.5% | -22.1% | -26.3% | |
| San Jose | 10 | -13.6% | -3.0% | -22.4% | 14.1% | |
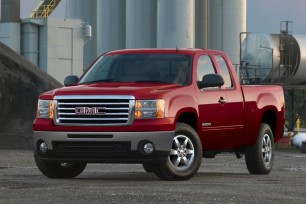
People in cities prefer trucks 35.4 percent less than people from less populated areas. In New York, shoppers were 77.8 percent less likely to prefer a pickup, with Chicago being close behind at 72.3 percent less. The exception is in Texas where San Antonio shoppers actually prefer trucks 18.3 percent more compared to the rest of the US.
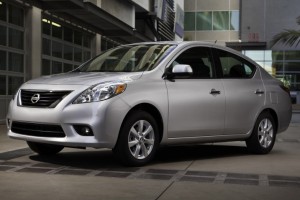 Another difference is with sedans. Somewhat surprisingly, sedans are more popular in cities than they are elsewhere. On average, car shoppers in the 10 largest US cities prefer sedans 10.5 percent more than those living outside of the big cities. The top 10 cities, however, are not uniform in their preferences. Shoppers in New York, San Jose and San Diego prefer sedans less than the rest of the country, but shoppers in the other seven cities prefer sedans 2.1 percent to 18.7 percent more.
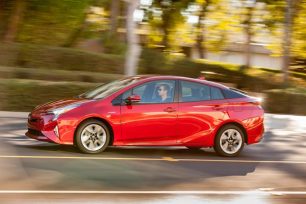
California car shoppers in Los Angeles, San Diego and San Jose have higher preferences for hatchbacks than the rest of the country by 71.6 percent to 84.5 percent. This may be due to California’s cultural and legal expectation for better fuel economy, which comes from smaller vehicles that are generally more versatile as hatchbacks. For example, the Toyota Prius' top US sales is in California, where the car sells more than double its national average, according to Toyota.
In New York, the tighter quarters and incentives for hybrid vehicles might make buyers more likely to consider a hatchback like the Prius or the small Nissan Versa Note.
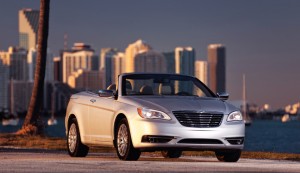 Another interesting but somewhat obvious finding is in convertible vehicle sales. Topless cars are preferred less in most cities versus everywhere else, with the exception of traditionally sunny cities such as Phoenix and Los Angeles. Car shoppers in the city are 13.1 percent less likely to want a convertible. The most extreme non-convertible interest comes from Chicago and Philadelphia, where buyers are 50.7 percent and 55.7 percent less interested in convertibles. On the other hand, shoppers in Phoenix are 41.2 percent more interested in convertibles, and shoppers in Los Angeles and San Diego are 49.6 and 38.6 more interested.
Car shoppers in large cities show more interest in luxury vehicles: a 17.2 percent greater preference than the rest of the country. This trend is driven by cities like New York and Los Angeles, where buyers are 79.7 percent and 62.6 percent more interested in luxury vehicles. That trend is not difficult to understand, considering that the median income of people living in most of the nation’s large cities is generally higher than that of people living outside of those cities.
Methodology
iSeeCars.com analyzed over 1.1 million shoppers' inquiries of used cars on iSeeCars.com between January 1, 2014 and April 28, 2017. Based on the shopper's ZIP code, the inquiry was either classified into one of the top 10 cities (by 2015 population) or into a group representing the rest of the country. The body type of each inquired car was tallied and expressed as a share of inquiries for each body type, within the top 10 cities and the rest of the country. Cars were also grouped together based on whether they came from a luxury or non-luxury brand, and the share of inquiries for each category was also compared between the two geographical groups. The difference in shares was expressed as a percentage of the inquiry share of each category from the rest of the country. Positive values mean higher interest than outside the top 10 cities, negative values mean lower interest.


