Toyota’s recall rate went from one of the best to last over 10 year periods from 1985 to 2014
WOBURN, Mass. (April 2014)- In most situations one would think an automaker would see the sales and reputation damage done by a recall campaign and make changes to prevent future recalls and act quickly when they do occur. A new study by iSeeCars.com shows that doesn’t always appear to be the case for some automakers, and time hasn’t shown improvement for many of them either.
In this study, iSeeCars.com analyzed and compared automakers’ “recall rates” and “recall timeliness” over 10 year periods from 1985 to 2014 mainly 1985-1994, 1995-2004 and 2005-2014. Recall rate measures the number of recalled vehicles for each vehicle sold – thus a low recall rate is more desirable. Recall timeliness looks specifically at the percentage of an auto maker’s recall campaigns involving vehicles within their first three years; the higher the percentage, the more timely the manufacturer is in detecting problems and issuing the necessary recalls.
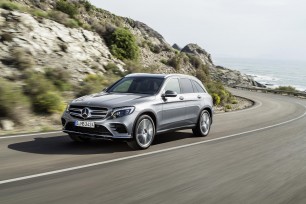
Between 1995-2004 and 2005-2014, all manufacturers improved their recall rates with the exception of Subaru, Hyundai, Honda and Toyota. On the other hand, from the time period of 1985-1994 to 1995-2004, only 3 auto makers saw their recall rates improved. In the most recent 10 year period 2005-2014, Mercedes has the best recall rate and Nissan had the best recall timeliness.
Mitsubishi Stands Out As Most Improved Over Past 10 Years
Mitsubishi made major strides in improving recall rates and increasing recall timeliness in recent years. It actually improved recall rates by 49% by going from recalling 177 vehicles for every 100 sold between 1995-2004 to recalling 90 vehicles per 100 sold between 2005-2014. It also increased the timeliness of recall campaigns by 22%. Between 1995-2004, only 62% of Mitsubishi’s recall campaigns included vehicles within their first 3 years. However, in the most recent 10 years, its timeliness improved to 84%.
Toyota’s recall rate went from first to last
While major recalls in 2009-2010 negatively impacted Toyota’s recall rate and timeliness of recalls, the company had a surprisingly strong combination of a low recall rate and high timeliness percentage in the earlier years of this study. It maintained a 0.26 rate of recalled vehicles per unit sold from 1985-1994, and again in 1995-2004. In looking at timeliness it had a fairly positive figure of 89% of recall campaigns involving vehicles within their first three years from 1985-1994, and again in 1995-2004. Fast-forward a few years and the unintended acceleration recalls significantly change Toyota’s rankings. Toyota's recall rate has gone from first to worst in the last 10 years (from 1995-2004 to 2005-2014). Toyota also saw its timeliness slip by 32%, the most of any manufacturer, going from 88.7% to 56.5%.
However, Toyota does appear to be working to improve its numbers from the past 10 years. “In the wake of the 2009-2010 recalls and subsequent fines, Toyota has given a detailed outline of actions the company has taken,” Ly says. “Those include launching a ‘rapid response team’ to address customer issues and lengthening the new vehicle development timeline by four weeks.”
Honda has seen its recall rate slowly rise over 30 years and its timeliness percentage drop. So not only is it recalling more vehicles per unit sold, it is taking progressively longer to do it. Honda has a recall rate/timeliness percentage of 0.42/89% (1985-1994), 0.94/89% (1995-2004) and 1.41/63% (2005-2014).
Manufacturer “Recall Rate” Trends - Number of Recalled Vehicles per Unit Sold
| 1985-1994 |
1995-2004 |
2005-2014 |
||||
| Manufacturer | Rate |
Rank |
Rate |
Rank |
Rate |
Rank |
| Mercedes-Benz USA, LLC. | 0.45 |
6 |
0.52 |
2 |
0.38 |
1 |
| Mazda Motors | 0.40 |
4 |
1.00 |
8 |
0.55 |
2 |
| Kia Motors Corporation | 0.54 |
9 |
0.96 |
7 |
0.68 |
3 |
| BMW of North America, LLC | 1.31 |
13 |
0.90 |
5 |
0.87 |
4 |
| Nissan North America, Inc. | 0.26 |
1 |
1.20 |
11 |
0.90 |
5 |
| Mitsubishi Motors North America, Inc. | 0.84 |
12 |
1.77 |
14 |
0.90 |
6 |
| Subaru of America, Inc. | 0.68 |
10 |
0.84 |
4 |
0.92 |
7 |
| General Motors LLC | 0.46 |
7 |
1.02 |
9 |
0.96 |
8 |
| Chrysler Group LLC | 0.33 |
3 |
1.82 |
15 |
0.98 |
9 |
| Volkswagen of America, Inc. | 1.64 |
14 |
1.18 |
10 |
1.08 |
10 |
| Hyundai Motor Company | 1.67 |
15 |
0.83 |
3 |
1.15 |
11 |
| Ford Motor Company | 0.52 |
8 |
1.40 |
12 |
1.31 |
12 |
| Volvo Cars of N.A., LLC | 0.73 |
11 |
1.49 |
13 |
1.32 |
13 |
| Honda (American Honda Motor Co.) | 0.42 |
5 |
0.94 |
6 |
1.41 |
14 |
| TOYOTA MOTOR CORPORATION | 0.26 |
2 |
0.26 |
1 |
1.67 |
15 |
Automaker’s “Recall Timeliness” – Percentage of Recall Campaigns Involving Vehicles within their first 3 Years
| % of recall campaigns for vehicles within their first 3 years | 1985-1994 |
1995-2004 |
2005-2014 |
|||
| Manufacturer | % |
Rank |
% |
Rank |
% |
Rank |
| Nissan North America, Inc. | 82.8% |
11 |
83.8% |
9 |
86.5% |
1 |
| Chrysler Group LLC | 90.7% |
3 |
75.0% |
13 |
84.4% |
2 |
| Mitsubishi Motors North America, Inc. | 78.6% |
13 |
62.1% |
15 |
84.4% |
3 |
| Volvo Cars of N.A., LLC | 88.2% |
8 |
80.6% |
11 |
83.7% |
4 |
| BMW of North America, LLC | 90.9% |
2 |
93.3% |
1 |
80.7% |
5 |
| Volkswagen of America, Inc. | 83.1% |
10 |
62.7% |
14 |
76.7% |
6 |
| Subaru of America, Inc. | 80.0% |
12 |
88.9% |
4 |
76.0% |
7 |
| General Motors LLC | 89.6% |
4 |
86.6% |
7 |
75.1% |
8 |
| Mercedes-Benz USA, LLC. | 77.8% |
14 |
90.6% |
2 |
75.0% |
9 |
| Mazda Motors | 88.9% |
5 |
79.7% |
12 |
74.1% |
10 |
| Ford Motor Company | 88.1% |
9 |
82.1% |
10 |
70.4% |
11 |
| Kia Motors Corporation | 100.0% |
1 |
85.7% |
8 |
68.8% |
12 |
| Hyundai Motor Company | 69.2% |
15 |
90.0% |
3 |
67.3% |
13 |
| Honda (American Honda Motor Co.) | 88.5% |
7 |
88.5% |
6 |
63.2% |
14 |
| TOYOTA MOTOR CORPORATION | 88.7% |
6 |
88.7% |
5 |
56.5% |
15 |
VW, Kia and Nissan Show Fluctuations Through 10-Year Timeframes
At 0.26 vehicles recalled per unit sold, Nissan of North America had the lowest recall rate of the 15 manufacturers analyzed in the 1985-1994 time period. However, it drops significantly to the 11th place ranking in the 1995-2004 timeframe, then it jumps to 5th in 2005-2014. And, while its recall rate fluctuated, its timeliness percentage rose from 83% (1985-1994), to 84% (1995-2004), to 87% (2005-2014). Those figures actually brought Nissan from 11th place ranking for timeliness of recalls in the 1985-1994 time period to 1st place in the 2005-2014 timeframe.
While slowly improving across the three 10-year periods, Volkswagen maintains a fairly high recall rate and ranking of being one of the least timely manufacturers to recall vehicles within the first three years. VW has a recall rate/timeliness percentage of 1.64/83% (1985-1994), 1.18/63% (1995-2004) and 1.08/77% (2005-2014).
Kia, on the other hand, has seen both its recall rate and timeliness percentage drop significantly over 30 years, so while it is recalling less vehicles per unit sold, it is also taking more time to do it.
So what does a manufacturer’s recall rate and recall timeliness tell consumers? “A lower recall rate could be an indication an automaker has relatively better manufacturing and quality control processes,” said Phong Ly, CEO and co-founder of iSeeCars.com. “Recall timeliness could suggest the caliber of the procedure or system an auto maker has in place to detect problems after a vehicle has been produced. Both the recall rate and timeliness could also be an indication of a manufacturer’s risk tolerance or strategy,” Ly explained.
“While the goal of automakers should be as few problems with vehicles as possible, it’s assumed that they’d like to see a trend of a low recall rate and high timeliness percentage,” Ly said. “This allows consumers to trust that the automaker is not only producing safe vehicles, but acting rapidly to protect the public when a potential issue arises.”
Methodology:
For this study, iSeeCars.com analyzed NHTSA recall figures between 1985 and 2014 (March 10) in 10 year periods, and corresponding sales data between 1985 and 2013. Recall rate is calculated as the number of recalls in a given period divided by the number of vehicles sold in that timeframe. Recall timeliness for an auto maker is calculated as the number of recall campaigns that included vehicles within their first 3 years divided by the total number of recall campaigns in a given time period.
About iSeeCars.com: